Socrata for Public Finance
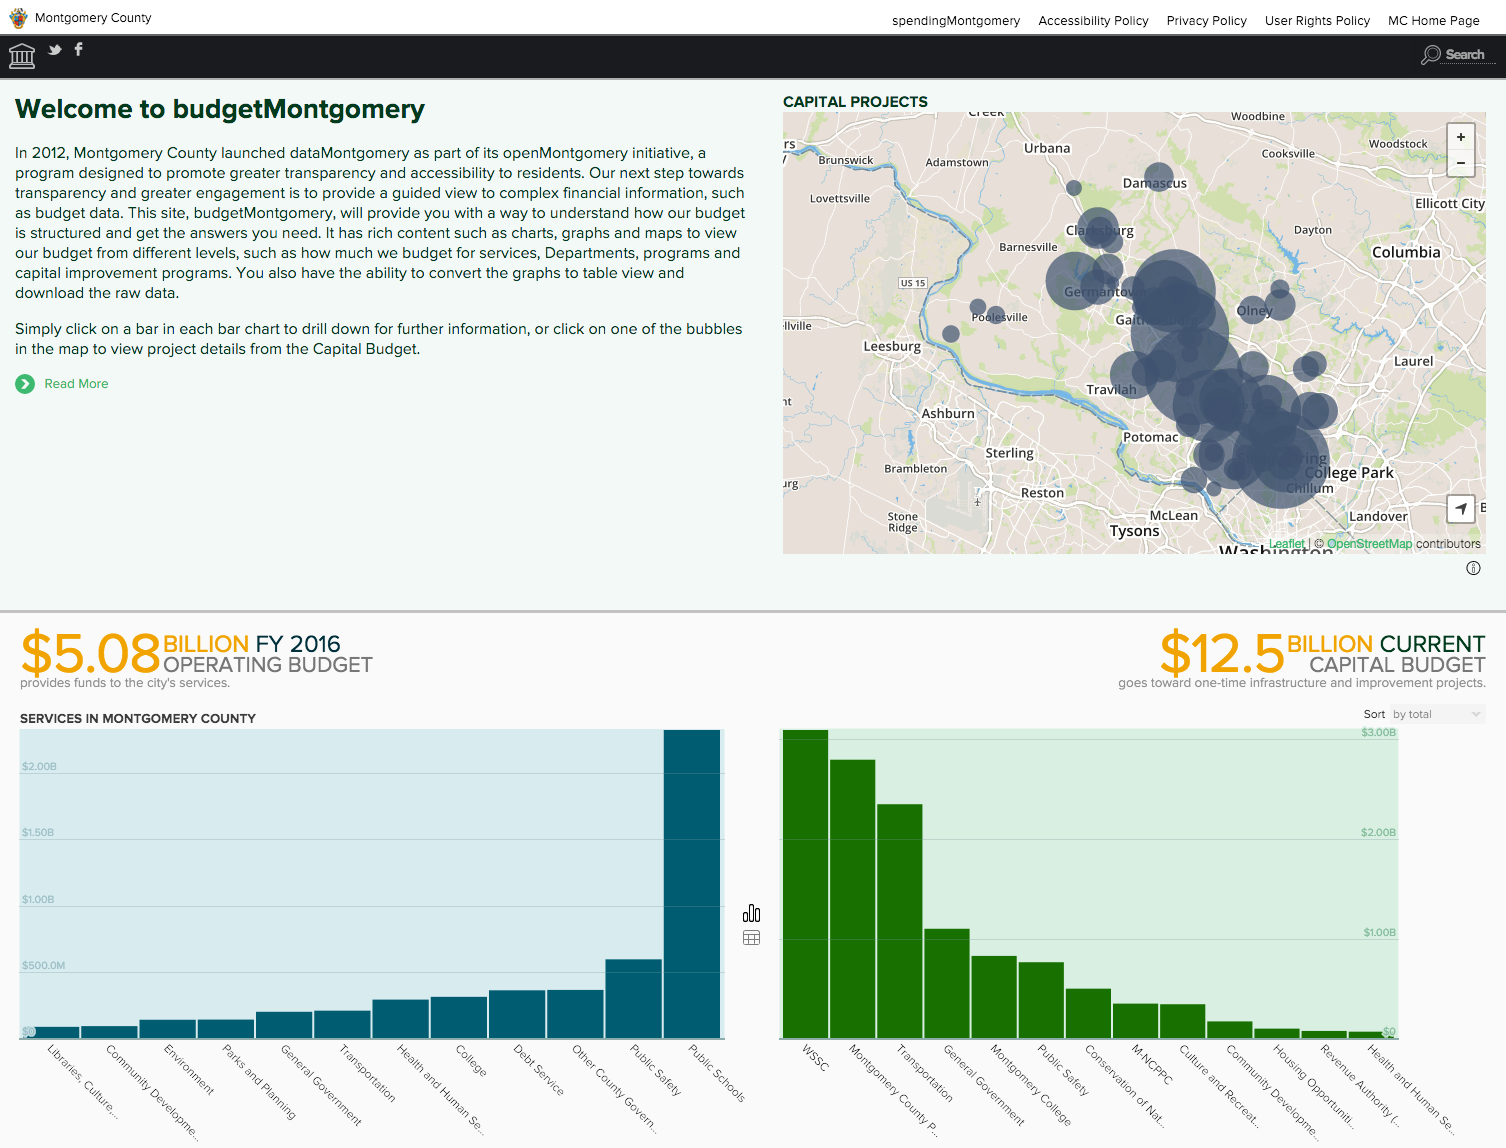
Reimagined, designed, and shipped the second and third major releases of Socrata for Public Finance, a suite of consumption-focused web apps that included Open Budget, Open Expenditures, and a new addition, Open Payroll. The product saw 10x growth in revenue the year after release.
My Role
I was the primary designer working on Socrata for Finance. The early version of the product suite was handed to me from other members of the Socrata design team. I was paired with product manager Michael Lu to level up the product and business. I drove the design from research and discovery to prototyping, interface design, implementation, shipping, and ongoing iteration. At later stages of the product lifecycle, and as our pace increased, I pair designed with another Socrata designer. Our team also made huge strides working alongside a fantastic group of engineers that could iterate quickly and took bias for action to new heights.
Problem
Socrata had discovered that a subject-area specific offering in government finance had the potential to be a huge success. Cities, states, and counties were looking for an out-of-the-box solution to citizen-facing financial information sharing.
The first generation of apps needed to be re-imagined for scale and repeatability. They were overly specific to the unique needs and desires of early design partners. For example, the apps were dogged by a rigid data schema, inflexible interaction patterns, and a limited design language. A key component of the user experience challenge was at once arriving at a product that was simple enough for a finance novice, yet desirable for users and buyers within the government who had deep understanding of fiscal policy and planning.
Process
Understanding the problem and solution space started by taking a good look at the first generation Open Budget product and its short list of customers. I then drove the effort to develop a new, deeper understanding of user scenarios through lightweight, ethnographic research, listening sessions, and user testing of the first version of the product.
Research
We set out to answer the question of how city, county, and state government officials and finance experts educate and communicate financial information to constituents. I developed a set of question prompts and the product manager and I spent time in the field talking with customers about the problem space.
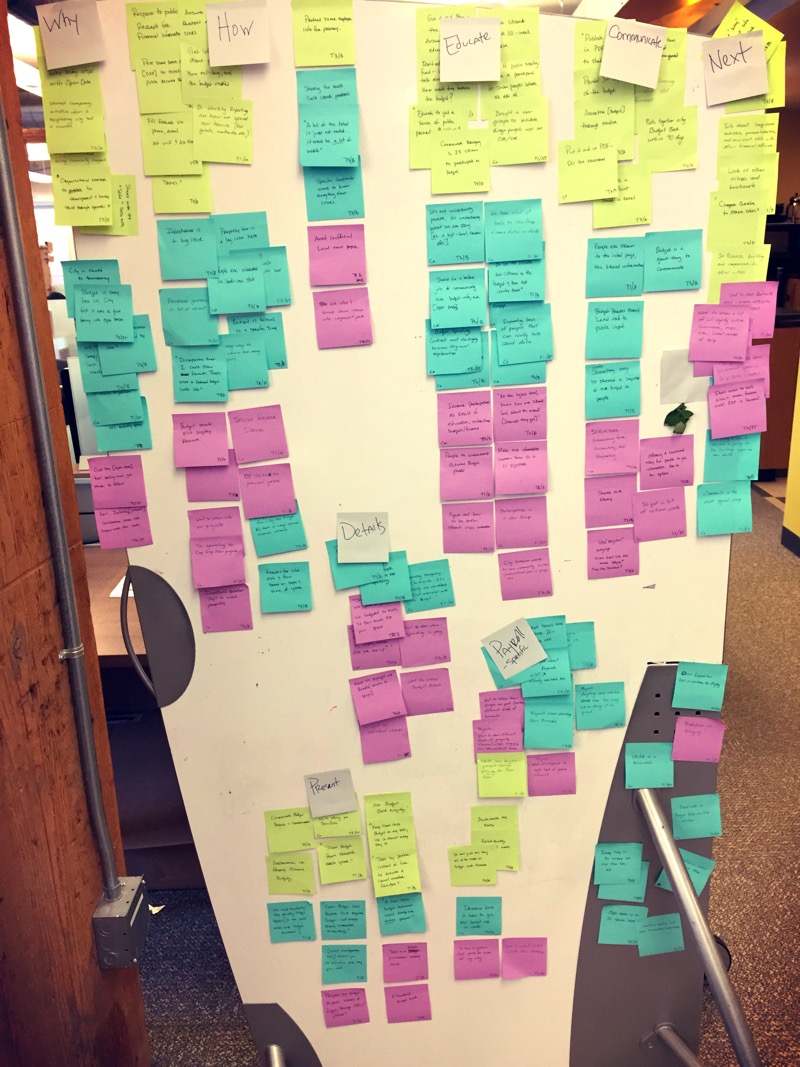
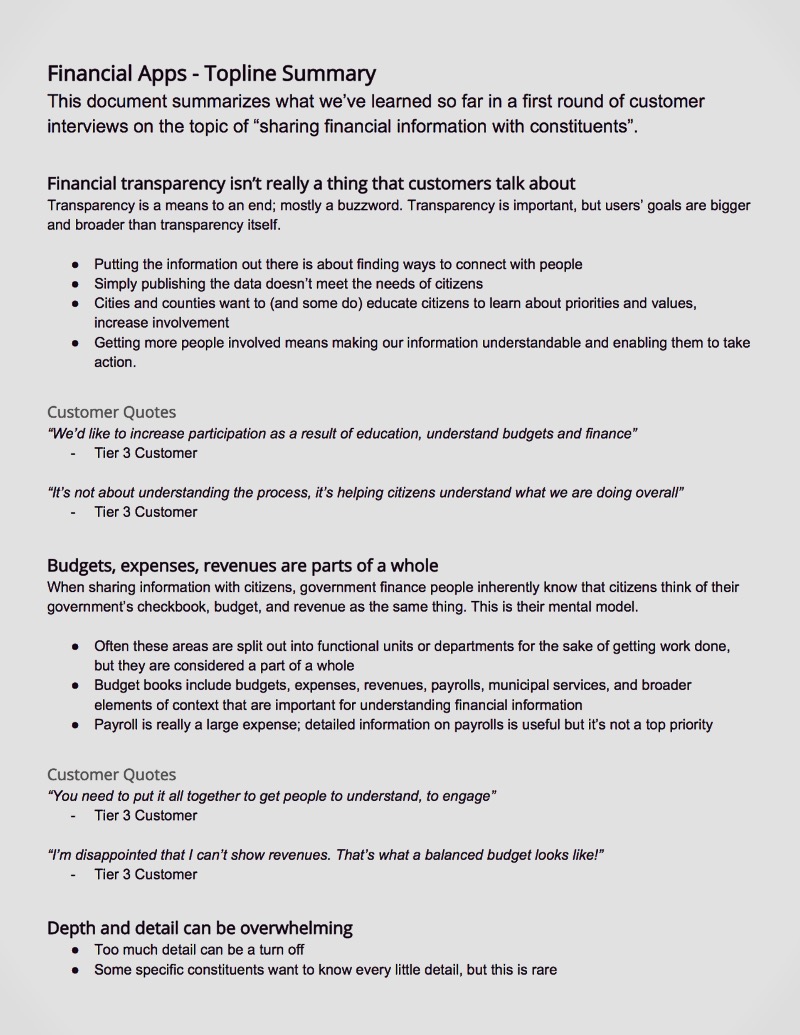
The assumption was that the product solved a problem of fiscal transparency. While this turned out to be true on the surface, digging deeper we came to learn that there was a greater desire to educate and inform constituents about the budgeting process and to contextualize through narrative. Government finance experts know that finance is a complicated topic, and transparency in data could not exist without context.
I also spent a good deal of time looking at competitive and analog products in the market. Governments had developed a host of home-grown solutions, used enterprise-class products; some spent millions in tax-dollars each year to fund and run what amounted to data-dense, yet information sparse websites. This provided a lot of insight about our customer’s intent as well as some good inspiration for where we could take the product surface itself.
One important realization was that governments created elaborate infographics and newsletters to share financial information with their citizens. One large city even configured the first version of the Open Budget application to include such an infographic. The insight was that governments used their “budget” to serve information-sharing and education scenarios, while spending and checkbook-level detail—our expenditures and payroll offerings—served reporting and compliance scenarios.
Another important insight was that while Socrata thought in terms of datasets—budget dataset, spending dataset, and so on—citizens and government workers saw these as interconnected. The product needed to divorce its technical, data-centered architecture to better support users of the end product.
Finally, there were a handful of basic usability and information design problems that I discovered through user observation and analysis of the existing products.
Prototyping, Design, and Testing
Orienting around our insights from research, I began design explorations with a focus on introducing narrative content into the experience. I explored ideas through sketched concepts and low fidelity wireframes.
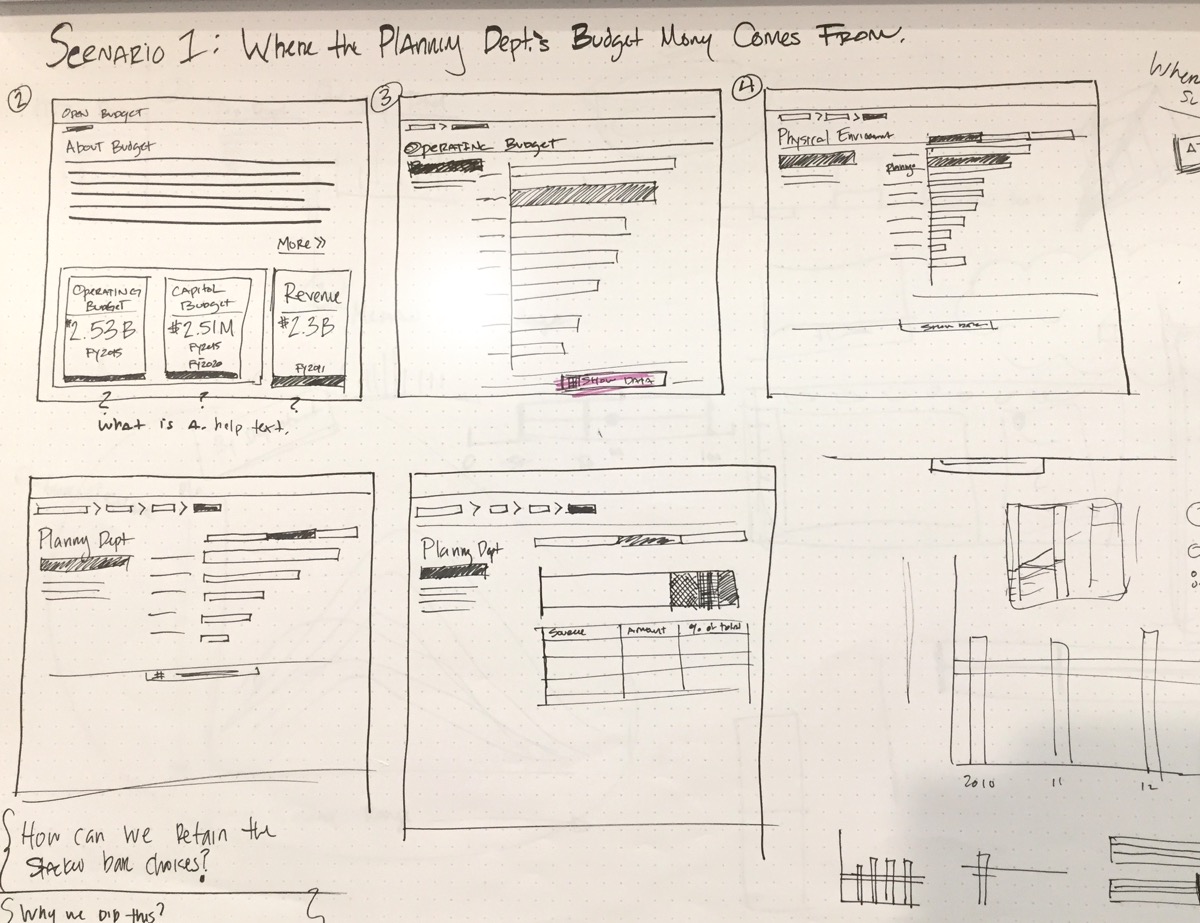
These early sketches helped me identify constraints around the data as well as the business need to make app configuration self-service for our customers. Because the product was so data-rich, I also spent a good deal of time exploring financial data in Excel. There’s nothing quite like using real-data to examine and find the edges of an information design. Those explorations helped me arrive at many of the information visualizations that ended up in the apps.
Along the way, I sought reviews, feedback and input from our customers as well as the Socrata team. This made it possible to quickly iterate on ideas, find new possibilities, and uncover underlying constraints. One of those constraints was rooted in fund-based accounting, the prevailing structure of government finance and financial data structures.
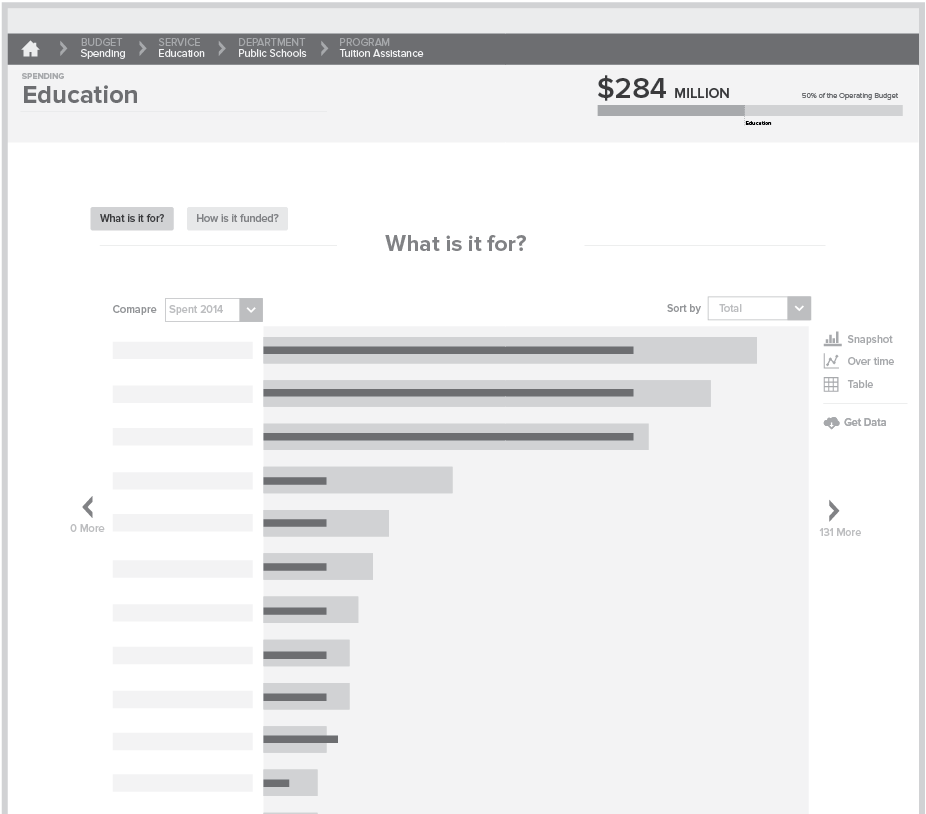
The existing app provided a drill-in experience aligned to these hierarchical, finance data schemas. This turned out to be quite desirable to our customers, but lacked usability. The information was dense and employed odd interaction patterns. I didn’t want to throw out all of this goodness, so I built a fully functioning prototype using D3 to explore and test the proposed modifications.
As we started to zero in on successful information designs, I started prototyping the in app experience, which would combine the data visualizations with the information architecture in a way that allowed users to forego an understanding of government finance and fluidly navigate through content. I took a great deal of care in honing and user testing the animations and drill-in experience to support these re-designed interactions.
Iteration & Outcomes
We shipped at the pace of one app per quarter and continued to improve the designs and product throughout the process. For example, we failed early on to understand the importance of making the drill in experience flexible enough for many new customers and they way they wanted to navigate the data structures. We introduced more flexibility to the data schema as well as the controls to support this complexity.
We also learned that customers had a huge desire to connect more narrative and context to specific aspects of their finance data and so later introduced capabilities for customers to configure and connect additional reporting and narrative to their apps.
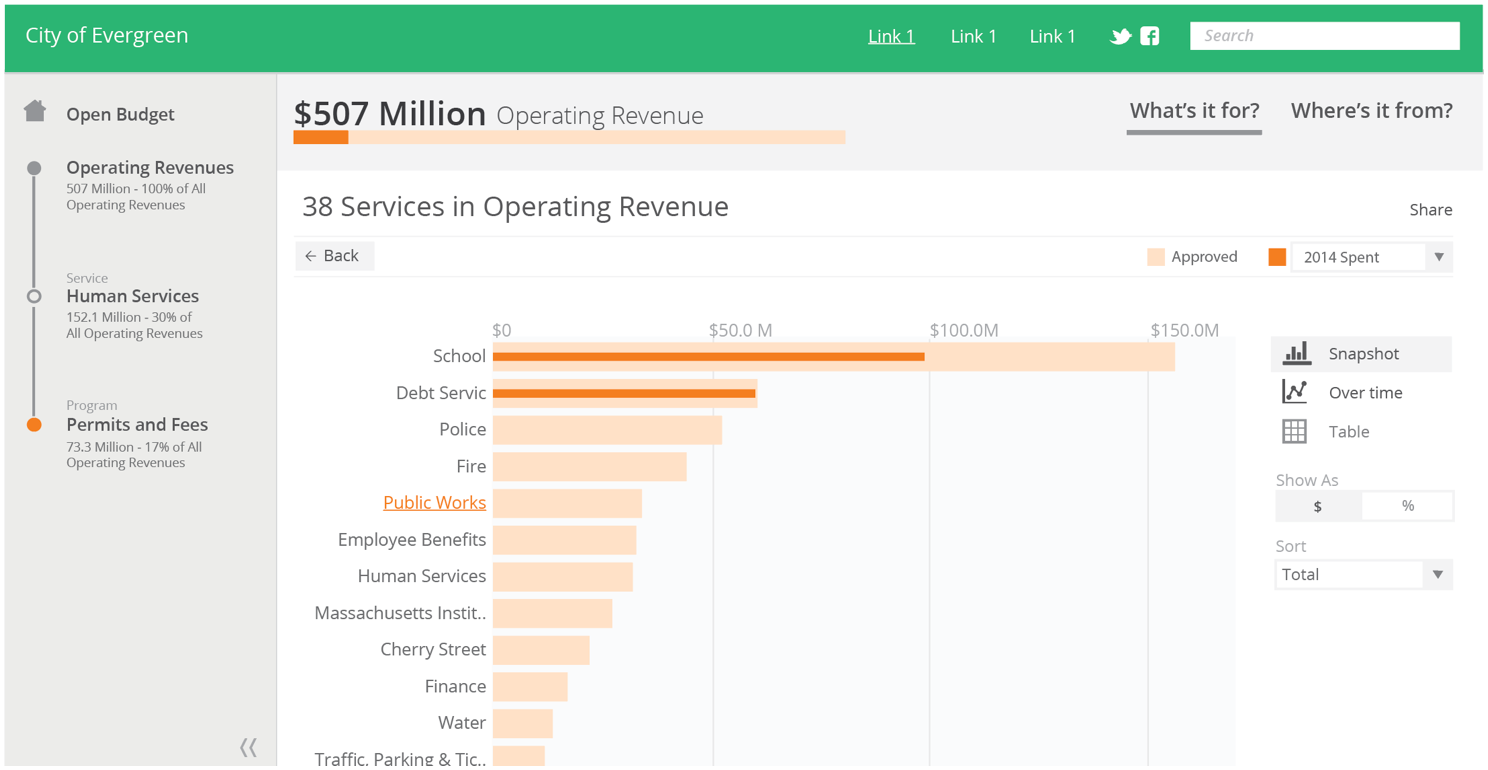
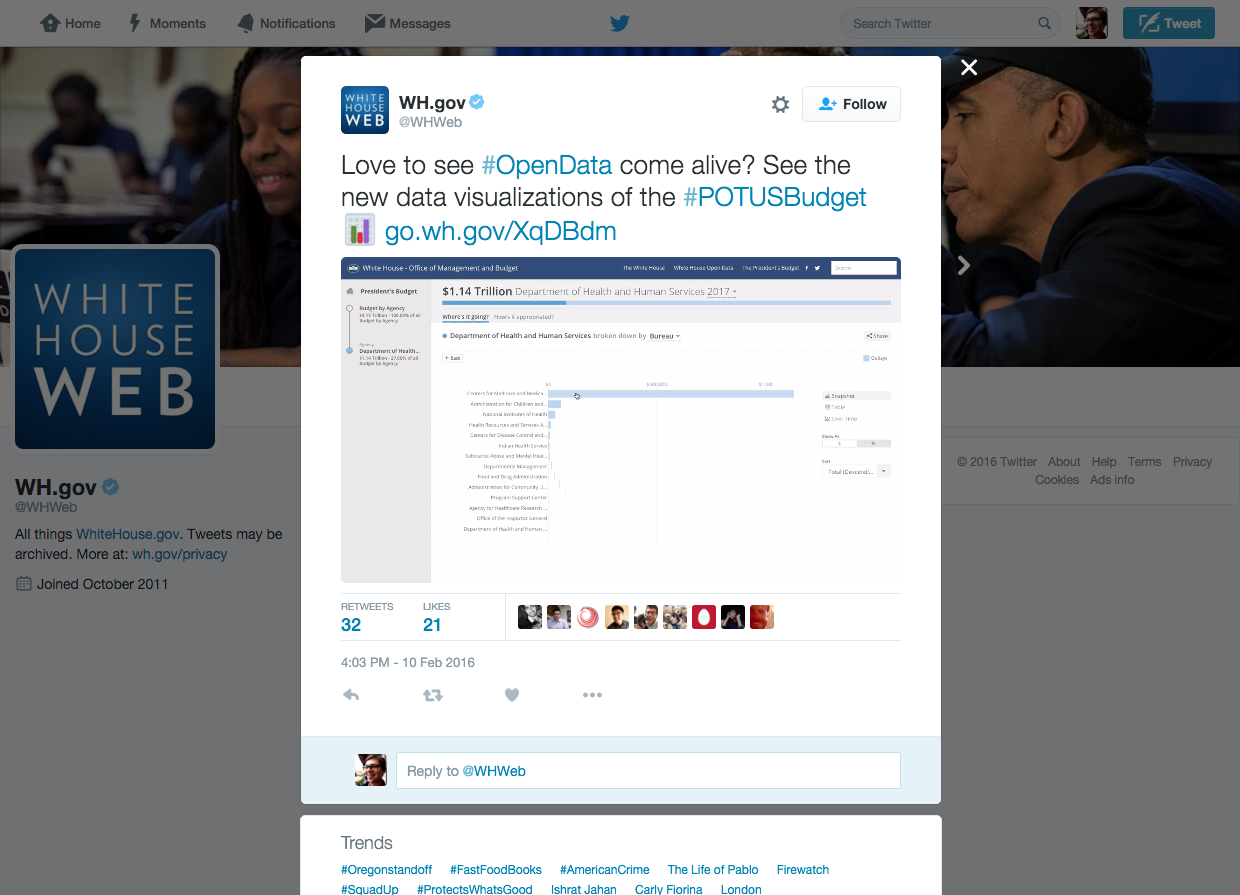
The result was a set of apps that helps a wide range of cities, counties, states, and even the Obama White House communicate complex financial data through an easy to use and understand data tool.
Media
The Obama White House used Socrata for Finance as a component of their fiscal transparency and responsibility initiative in early 2016.
Humbolt County California weighs in on “how unbearably awful” new products and features are, or not. Verdict: doesn’t suck.
DOES THIS SUCK? Humboldt County Releases New Interactive Budget Visualization Thingy
Customer Quotes
State of Massachusetts
“We literally cut out not just the middleman, we’ve cut out a whole group and a layer of bureaucracy around those public records requests that is going to allow free and open access to the data.”
–Tom Shack, State Comptroller
Sedgwick County, KS
“The only word I can think of that describes this is impressive. I’m just blown away at how much utility is in this tool… It’s a tremendous tool, I’m really impressed… this is a great thing for the public.”
–Jim Howell, District commissioner